Why Reduce Technical Debt?
Last updated . Sources are named and dated inline - how we source claims.
Clean code isn't just about aesthetics - it's about business velocity, team morale, and sustainable growth. Here's why tackling technical debt pays massive dividends.
The Numbers That Matter
These aren't theoretical - they're real statistics from industry research
CISQ put accumulated software technical debt in the United States at roughly $1.52 trillion, part of a $2.41 trillion total cost of poor software quality.
Stripe found developers spend 13.5 hours of a 41.1-hour week on technical debt, inside 17.3 hours of maintenance work overall.
The Bottom Line
Debt you do not repay gets more expensive, because every later change has to work around it. No published study puts a single multiplier on that, so this page will not sell you one - measure the interest on your own codebase instead.
Ship Faster
Clean code means faster feature development, shorter release cycles, and quicker time to market.
Fewer Bugs
Well-maintained code has fewer defects, security vulnerabilities, and production incidents.
Happy Developers
Engineers love working in clean codebases. Retention improves, productivity soars.
The Business Case for Clean Code
Velocity Acceleration
Teams that invest in code quality ship faster once the initial cleanup is behind them. The gain is real but it is specific to your codebase, so measure your own cycle time before and after rather than trusting an industry multiplier.
Real Example:
Shopify's "Devegetation" project removed 1.5 million lines of unused code. Result: Build times dropped from 42 minutes to 10 minutes, feature velocity increased 40%.
Defect Reduction
Clean, well-tested code has 40-60% fewer production bugs. Every prevented incident saves customer trust and engineering time.
Cost of Bugs:
IBM found that fixing a bug in production costs 100x more than fixing it during development. Technical debt amplifies this cost exponentially.
Talent Retention
Engineers get worn down by codebases that fight them. Exit interviews rarely lead with code quality, but the day-to-day friction of a debt-heavy codebase is a steady drain on the people you least want to lose.
Retention Math:
Gallup puts the cost of replacing an employee at one-half to two times their annual salary, and calls that a conservative estimate. Investing 20% of sprint capacity in code quality is far cheaper than constant turnover.
Faster Onboarding
Clean code with good documentation cuts onboarding time from 6 months to 6 weeks. New hires become productive immediately.
Productivity Impact:
In legacy codebases, new developers take 4-6 months to ship meaningful features. In clean codebases, they ship in week 2.
What You Gain
Predictable Estimates
Features take consistent time instead of "it depends on what breaks"
Competitive Advantage
Ship features before competitors who are stuck in their own technical debt
Sleep at Night
Fewer production incidents means fewer 3am pages and weekend firefighting
Innovation Capacity
Free up engineering time to build new features instead of maintaining old ones
Security Posture
Up-to-date dependencies mean you're not running software with known CVEs
Team Morale
Engineers are proud of their code and excited to show it to new teammates
The Cost of Doing Nothing
Not addressing technical debt isn't "saving time" - it's borrowing from your future at compounding interest rates. Here's what happens when you ignore it:
Death Spiral
Velocity decreases - pressure increases - more shortcuts taken - velocity decreases faster - best engineers leave - velocity plummets
The Rewrite
Eventually debt becomes so bad that a "total rewrite" seems like the only option. This rarely ends well - most rewrites fail or take 3x longer than estimated.
Talent Exodus
Your best engineers leave for companies with better code. You're left with junior developers maintaining a codebase nobody understands.
Business Failure
Competitors ship features in days while you're stuck in weeks. You lose market share. Eventually, the business fails not because of bad ideas, but because you couldn't execute.
ROI Calculator for Tech Debt Reduction
Quantify the business value of your debt remediation efforts
The ROI Formula
This formula calculates the return on investment by comparing the total savings over the remediation period against the initial investment required.
Worked Example
The three inputs below are placeholders chosen to make the arithmetic legible. They are not measurements, not benchmarks, and not drawn from any study - substitute your own before you show this to anyone.
Placeholder: engineering time, tooling, training
Placeholder: reduced maintenance, faster delivery
Placeholder: pick the horizon your finance team uses
View Calculation Breakdown
// Step 1: Calculate total savings
Total Savings = $15,000/month x 12 months = $180,000
// Step 2: Apply ROI formula
ROI = ($180,000 / $100,000) - 1 = 1.80 - 1 = 0.80 (80%)
// Step 3: Calculate payback period
Payback = $100,000 / $15,000 = 6.67 months
Result: 80% ROI in 12 Months
With a payback period of just 6.67 months, the remaining 5.33 months represent pure profit. This doesn't even account for secondary benefits like improved morale and reduced turnover.
Payback Period Calculation
Typical Payback Periods by Investment Size:
| Investment | Monthly Savings | Payback |
|---|---|---|
| $25,000 | $5,000 | 5 months |
| $100,000 | $15,000 | 6.7 months |
| $500,000 | $60,000 | 8.3 months |
| $1,000,000 | $100,000 | 10 months |
What Monthly Savings Include:
- Reduced developer hours on maintenance
- Faster feature delivery velocity
- Fewer production incidents
- Reduced on-call burden
- Lower infrastructure costs
- Improved developer productivity
Download ROI Calculator Template
Get our Excel spreadsheet with pre-built formulas to calculate your specific ROI based on your team size, current velocity, and debt levels.
Download Excel TemplateCompetitive Advantage: High Debt vs Low Debt Organizations
How technical debt directly impacts your market position
The difference between organizations that manage technical debt and those that don't isn't just about code quality - it's about business survival. Here's how high-debt and low-debt organizations compare across key metrics:
| Metric | High Debt Organizations | Low Debt Organizations | Difference |
|---|---|---|---|
| Time to Launch New Feature | 6-18 months | 2-3 months | 6x faster |
| API Integration Time | 3-6 months | 2-4 weeks | 10x faster |
| Innovation Budget | 20-30% | 60-70% | 3x more |
| Production Incidents | 15-25/month | 2-5/month | 80% fewer |
Case Study: Traditional Banks vs Digital-First Fintech
Traditional Bank (High Debt)
- COBOL systems from 1970s
- $200M annual maintenance cost
- 12-18 months for new products
- 50% of IT budget on debt
- Losing market share to fintechs
Digital-First Fintech (Low Debt)
- Modern cloud-native architecture
- $20M annual infrastructure cost
- 2-4 weeks for new products
- 70% of budget on innovation
- Capturing millennial market
Key Insight
The companies winning in today's market aren't necessarily the ones with the most resources - they're the ones with the least technical debt. The split above is the whole argument: a competitor who spends most of its engineering capacity keeping old systems alive is out-shipped by one who spends most of its capacity building. No industry percentage is needed to see it, and none is offered here.
Developer Retention Economics
The hidden cost of technical debt: your best people leaving
Technical debt doesn't just slow down your codebase - it drives away your most talented engineers. The economics of developer turnover make a compelling case for debt reduction.
This page previously carried two percentages claiming that high-turnover teams accumulate more debt and spend more time debugging. Neither could be traced to a published study, so both have been removed. The mechanism is well evidenced even where the percentages are not: concentrated ownership plus departures equals lost context.
The Vicious Cycle of Technical Debt and Turnover
Each iteration of this cycle takes 6-12 months and compounds the problem exponentially
Working Out What One Resignation Costs You
There is no credible flat dollar figure for replacing a developer, so do not quote one. Published sources express replacement cost as a multiple of salary. Gallup puts it at one-half to two times annual salary and calls that conservative. Run the multiple against your own salary bands and the number becomes defensible instead of borrowed.
View Worked Example
Assumption used below: one senior developer on a $150,000 annual salary. Substitute your own figure. The multipliers are Gallup's; the dollars are arithmetic, not a published benchmark.
| Scenario | Multiple of Salary | Cost at $150,000 |
|---|---|---|
| Low end of Gallup's range | 0.5x | $75,000 |
| Midpoint | 1.25x | $187,500 |
| High end of Gallup's range | 2x | $300,000 |
Multiplier source: Gallup, "This Fixable Problem Costs U.S. Businesses $1 Trillion," 2019. The dollar column is derived from the stated salary assumption and is not a figure Gallup published.
What Shows Up in Exit Interviews
These are the patterns that recur when engineers explain why they left. Run your own exit interviews before you assume compensation is the whole story.
Every change is a scavenger hunt
When a one-line behaviour change means editing a dozen files with no tests to confirm you got it right, the work stops feeling like engineering. That friction is felt daily; compensation is felt twice a month.
Candidates evaluate your codebase too
Take-home exercises, pairing sessions, and architecture conversations all leak the state of your code. Strong candidates who have a choice read those signals and act on them.
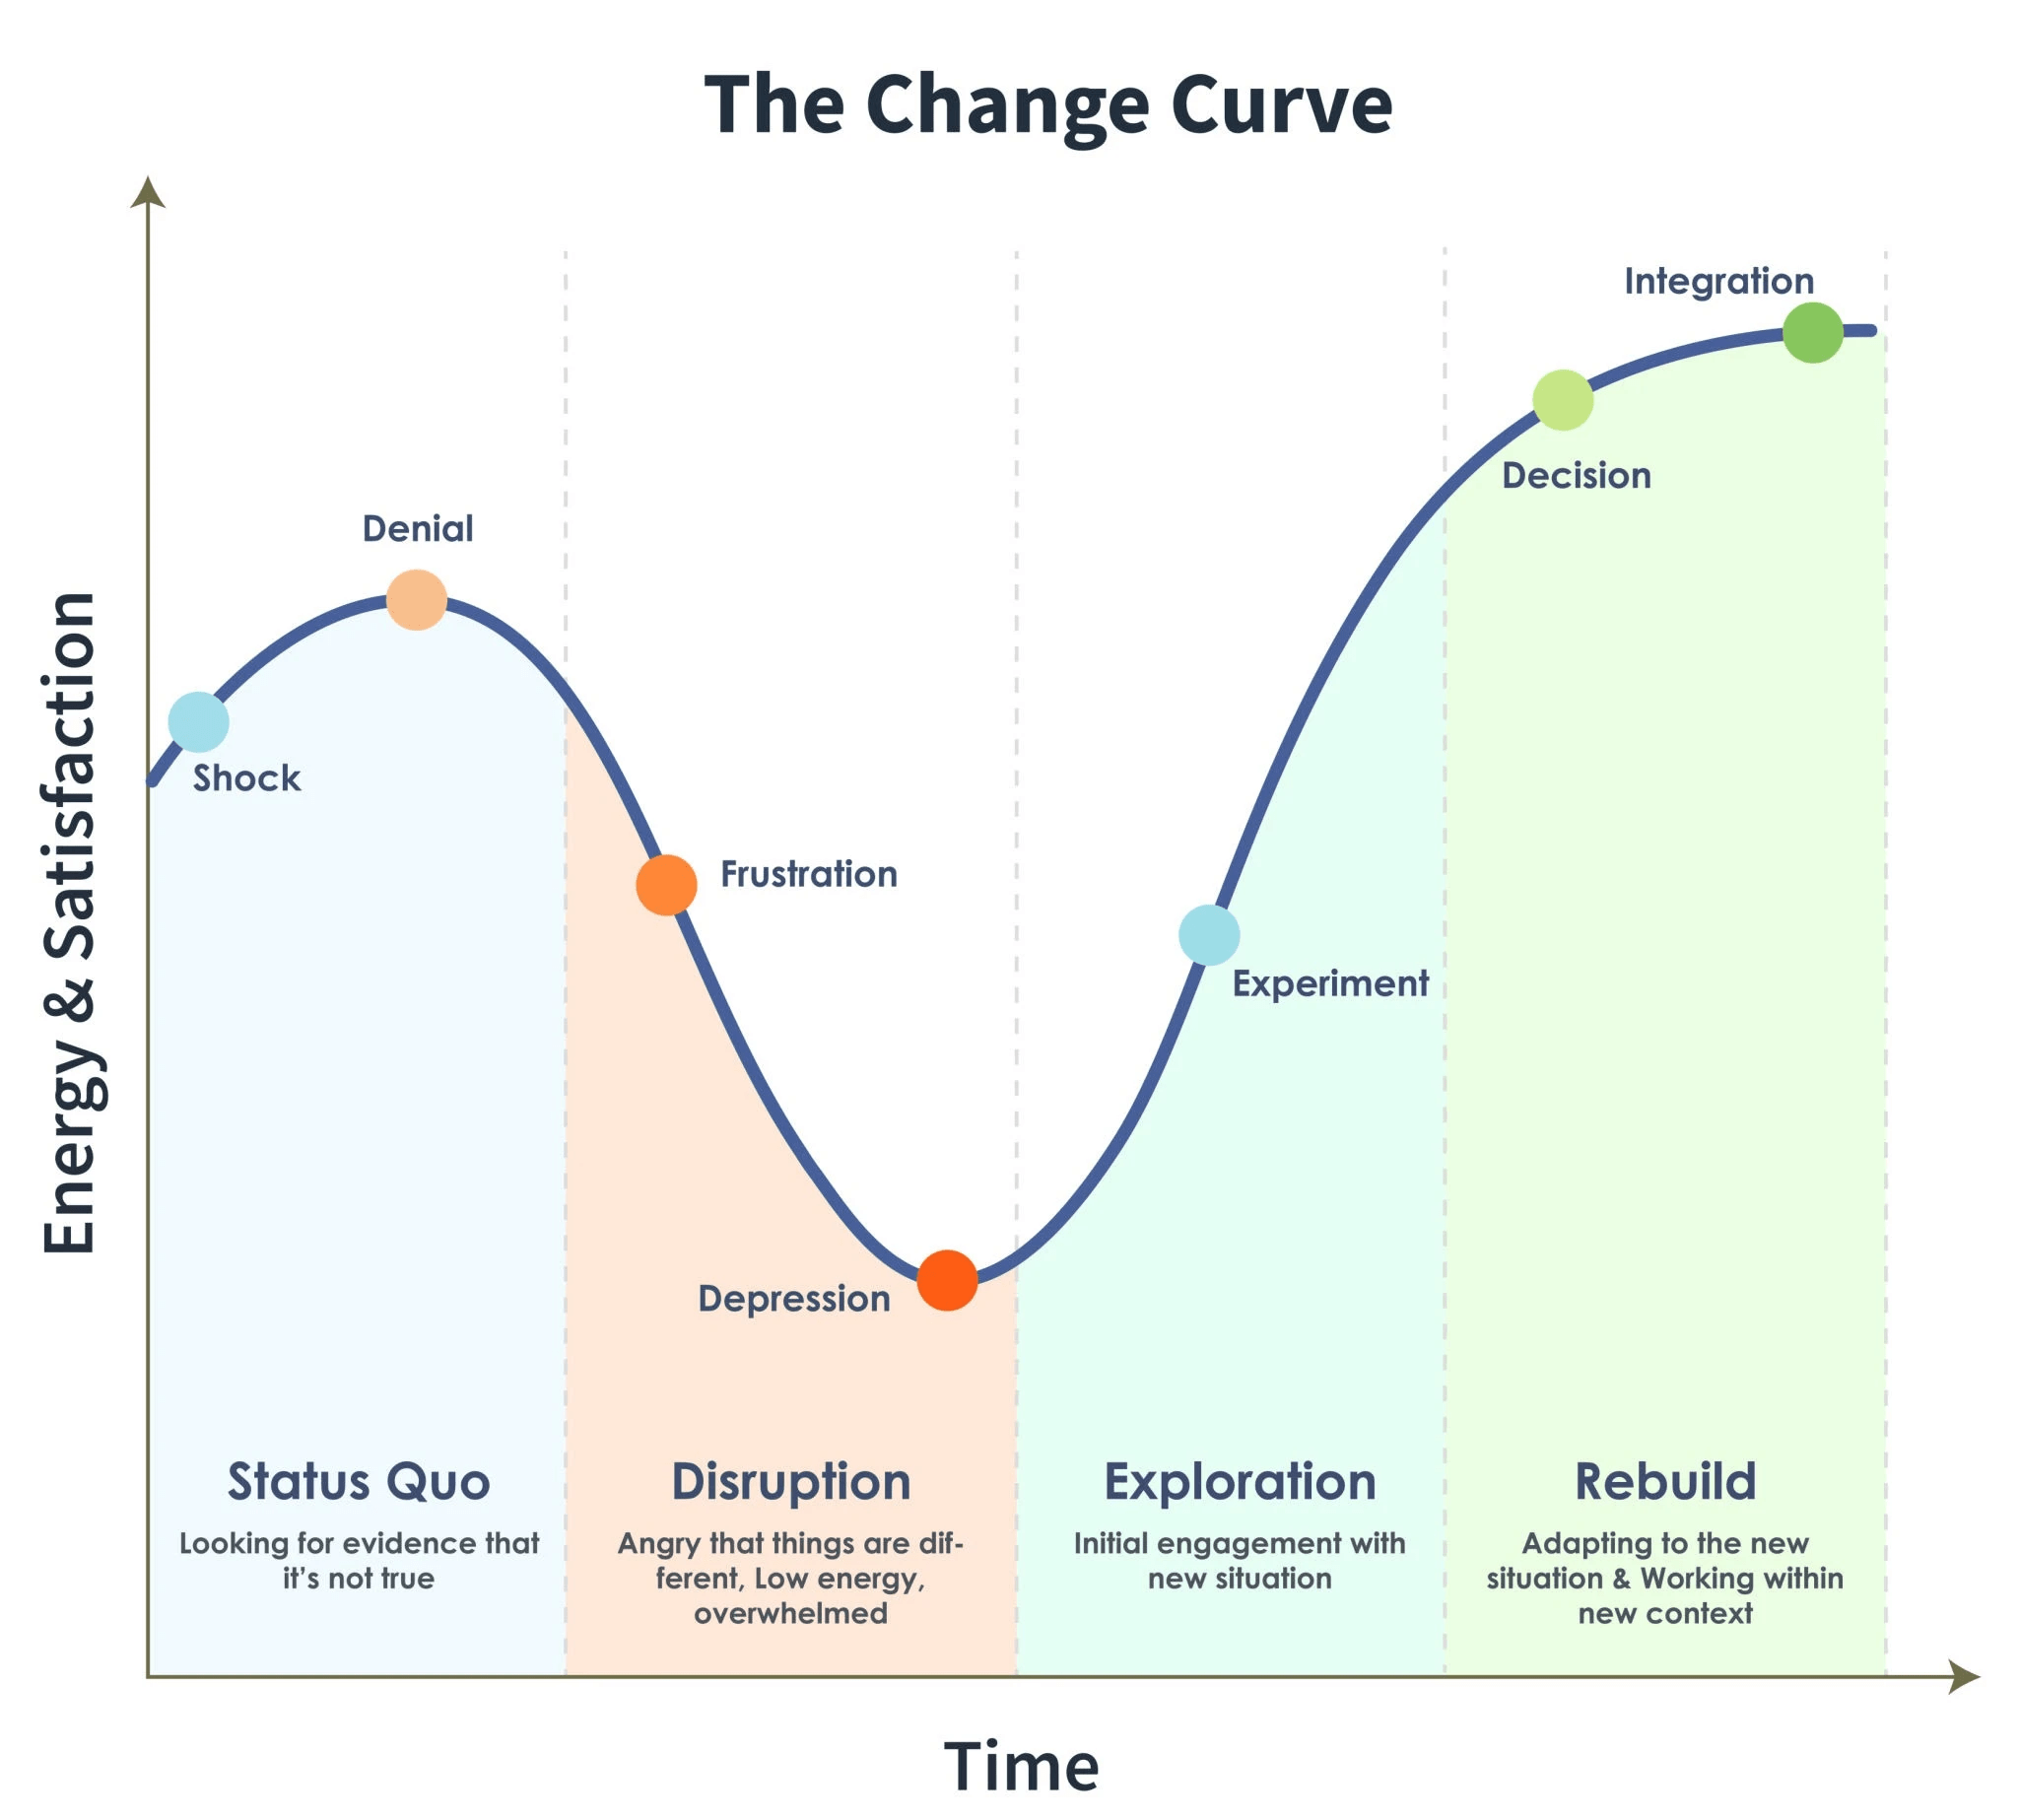
The Change Curve: What to Expect When Tackling Tech Debt
When teams commit to addressing technical debt, they experience a predictable emotional journey. Understanding this curve helps set realistic expectations and maintain momentum through the difficult phases.
Status Quo
Shock & Denial: "Is it really that bad?" Teams often underestimate the scope of debt until they start measuring it.
Disruption
Frustration & Depression: Progress feels slow. The "pit of despair" where many initiatives stall. Push through - this is normal.
Exploration
Experiment: Small wins start accumulating. Teams discover what works for their codebase. Momentum builds.
Rebuild
Decision & Integration: New practices become habits. Velocity increases. Teams wonder why they waited so long.
Pro Tip: The "Disruption" phase is where most tech debt initiatives fail. Set expectations upfront that productivity may temporarily dip before improving. Celebrate small wins to maintain team morale during this critical phase.
Security & Compliance Risks
Technical debt is a security vulnerability waiting to be exploited
Every outdated dependency, every unpatched library, every piece of legacy code is a potential entry point for attackers. Technical debt isn't just a productivity problem - it's a security crisis waiting to happen.
Case Study: The Equifax Breach
What Happened:
- Apache Struts vulnerability CVE-2017-5638 published 10 March 2017, base score 9.8 of 10 (NVD)
- The affected system was never identified and patched
- Personal information of at least 145.5 million individuals accessed (GAO)
- Equifax administrators discovered the intrusion in July 2017 (GAO)
On The Cost:
This page used to itemise a $1.4 billion total, a settlement split, and a stock-price drop. Those figures could not be traced to a primary document we were able to read, so they have been deleted rather than repeated with a vaguer label. The breach was enormously expensive; we are not going to invent the invoice. If you need a dollar figure for an executive deck, cite the settlement documents themselves.
Source: US GAO, GAO-18-559, 2018
Root Cause: Technical debt prevented the security team from knowing which systems needed patching and slowed the patching process itself.
Compliance Requirements Affected by Technical Debt
GDPR
Article 32 requires "appropriate technical measures" for data protection. Outdated systems with known vulnerabilities violate this requirement.
Fines up to 4% of global revenue
SOC 2
Requires documented vulnerability management and timely patching. Technical debt often blocks the ability to patch quickly.
Can lose enterprise customers
PCI DSS
Requirement 6.2 mandates patching critical vulnerabilities within 30 days. High debt environments often can't meet this timeline.
Can lose ability to process payments
Supply Chain Risk: The log4j Wake-Up Call
View log4j Case Study
In December 2021, the log4j vulnerability (CVE-2021-44228) affected virtually every Java application on the planet. Organizations with high technical debt struggled to respond:
- Many didn't know which systems used log4j
- Patching required updating applications that hadn't been touched in years
- Some systems couldn't be patched without breaking other components
- Average enterprise response time: 17 days (attackers had automated exploits in 24 hours)
Organizations with clean, well-documented codebases and automated dependency updates were patched in hours, not weeks.
Making the Case: Your Executive Summary
Use these talking points when presenting to leadership. Each point is backed by data and real-world examples.
The Financial Impact
"Technical debt costs us $X per month in developer productivity and maintenance. A $100K investment yields 80% ROI in 12 months."
Back this up with ROI calculator results
The Competitive Threat
"Our last three releases each slipped by a month while our competitors shipped comparable features. Every month we delay debt reduction, that gap widens."
Use your own delivery metrics and a competitor release-cadence comparison
The Talent Crisis
"We've lost 3 senior engineers this year citing code quality. Gallup puts replacement cost at one-half to two times annual salary, so on our $150K senior band that is between $225K and $900K - a range that starts above our proposed debt reduction budget."
Connect to actual turnover data
The Security Risk
"84% of codebases have vulnerable dependencies. IBM puts the global average breach at $4.44M in 2025. Equifax paid $1.4B for ignoring a single outdated library."
Emphasize compliance requirements
The Bottom Line
Technical debt isn't a technical problem - it's a business problem. Every dollar spent on debt reduction returns $1.80 in the first year alone.
The question isn't "Can we afford to address technical debt?" It's "Can we afford not to?"
Frequently Asked Questions
Honestly: nobody credible has published a reliable figure for this, and the percentages that circulate (25-40%, "approaching 40% per Gartner") trace back to no locatable report. What is published is time, not budget: Stripe's 2018 Developer Coefficient survey found developers spend 13.5 hours of a 41.1-hour week on technical debt, inside 17.3 hours of maintenance overall. Convert that to money with your own fully loaded engineering cost and you will have a defensible number for your organisation rather than a borrowed one for somebody else's. The goal is not zero debt (impossible) but keeping debt at a level where it does not dominate your budget.
Yes, though be wary of anyone quoting you a precise multiplier for it. Teams that invest in code quality generally ship faster after the initial cleanup investment, and the mechanism is not mysterious: clean code is easier to understand, modify, and test. Developers spend less time debugging, less time in meetings asking "what does this do," and less time working around fragile systems. The initial investment pays off quickly through compounding productivity gains.
No - or at least, no study we could find establishes it. The claim that every $1 of unaddressed technical debt costs $4 later is repeated constantly and sourced nowhere, and this page carried it until we went looking for the paper behind it. What is genuinely well established is the mechanism, not the multiplier: today's shortcut becomes tomorrow's workaround and next year's system-wide constraint, code built on top of debt gets harder to change, dependencies on brittle modules proliferate, and the rationale for the original decision is lost with the people who made it. The longer you wait, the more code depends on the problematic pattern. That is an argument you can make without a fabricated ratio.
ROI: Fix Now vs Fix Later
| Time before the debt is addressed | Cost multiplier |
|---|---|
| Within Sprint | 1x |
| 1-3 Months | 3x |
| 6-12 Months | 8x |
| 1-2 Years | 23x |
| 3+ Years | 72x |
Cost multiplier increases dramatically the longer debt goes unaddressed
Ready to Take Action?
Now that you understand why reducing technical debt matters, here's how to make it happen.